Fig. 5
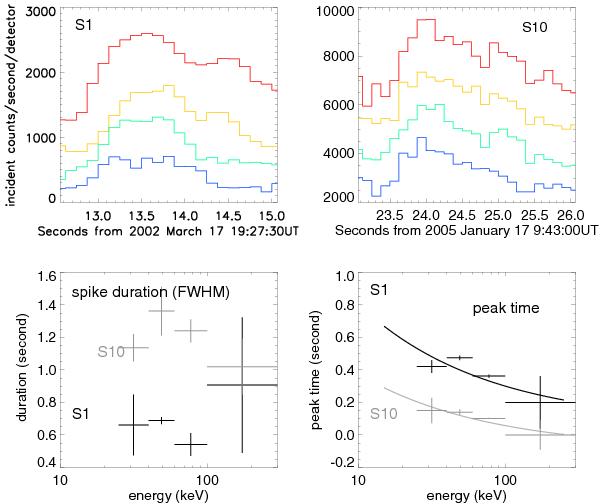
Examples of durations and peaking times of the spikes S1 and S10 at varying energies, derived from fitting the spike light curves to Gaussian profiles. Horizontal bars in the bottom panels indicate the widths of the energy bins, and vertical bars indicate 1σ fitting uncertainties. Lines in the bottom panel give the time-of-flight fit (see text).
Current usage metrics show cumulative count of Article Views (full-text article views including HTML views, PDF and ePub downloads, according to the available data) and Abstracts Views on Vision4Press platform.
Data correspond to usage on the plateform after 2015. The current usage metrics is available 48-96 hours after online publication and is updated daily on week days.
Initial download of the metrics may take a while.