Fig. 6
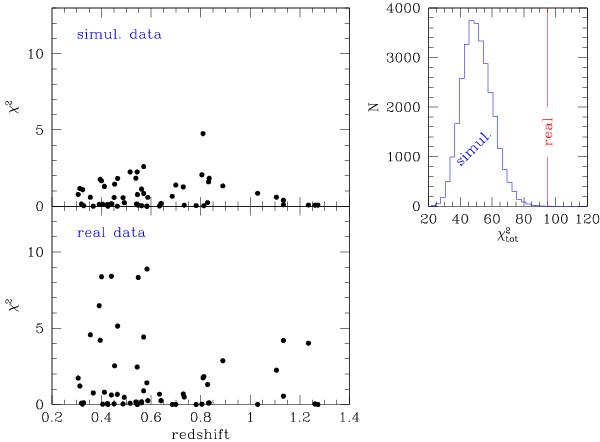
Illustration of how the fitted data reject the best-fit in previous works. The bottom-left panel shows the χ2 of the individual data points (from Balestra et al. 2007, chosen for illustration) vs. redshift. The χ2 is computed using the Balestra et al. (2007) best-fit. The top left-hand panel shows the same, but for data extracted from a realisation of the Balestra et al. (2007) fitted model. Real data scatter much more than simulated data, as quantified in the top right-hand panel: the total χ2 of 30 000 realisations of the Balestra et al. (2007) model is histogrammed, together with the total χ2 of their sample (vertical line). Either using χ2 tables (or the usual rule χ2/ν, ν ≈ 54) or more sophisticated simulations, the Balestra et al. (2007) data reject their best-fit at > 99.9 confidence.
Current usage metrics show cumulative count of Article Views (full-text article views including HTML views, PDF and ePub downloads, according to the available data) and Abstracts Views on Vision4Press platform.
Data correspond to usage on the plateform after 2015. The current usage metrics is available 48-96 hours after online publication and is updated daily on week days.
Initial download of the metrics may take a while.