Fig. 5
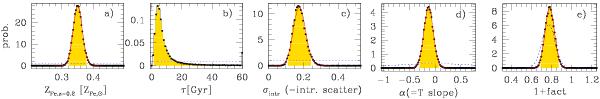
Probability distribution for the parameters of the metal abundance vs. redshift fit. The solid circles show the posterior probability distribution as computed by MCMC, marginalised over the other parameters. The red curve (when present) shows a Gauss approximation of it. The dashed curve displays the adopted prior. The shaded (yellow) range shows the 95% highest posterior credible interval.
Current usage metrics show cumulative count of Article Views (full-text article views including HTML views, PDF and ePub downloads, according to the available data) and Abstracts Views on Vision4Press platform.
Data correspond to usage on the plateform after 2015. The current usage metrics is available 48-96 hours after online publication and is updated daily on week days.
Initial download of the metrics may take a while.