Fig. 4
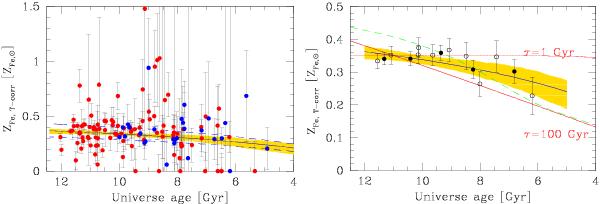
Metal abundance, on the Chandra scale, vs. Universe age. Left panel: observed values of metal abundance and errors are corrected for the T dependence and for the Chandra vs. XMM systematic as determined by a simultaneous fit of all parameters. Red (blue) circles refer to Chandra (XMM) measurements. Points indicate the maximum a posteriori, whereas error bars represent the shortest 68% probability intervals. The solid line marks the mean fitted relation between metal abundance and redshift, while the dashed line shows this mean plus or minus the intrinsic scatter σscat. The shaded region marks the 68% highest posterior credible interval for the regression. The distances between the data and the mean model are due in part to the measurement error and in part to the intrinsic scatter. Right panel: solid points are metal abundances, corrected as in the left panel, but binning in 5 (solid points) or 10 (open points) redshift bins. The solid line and shading are as in the left panel. Two extreme enrichment histories (red lines) and the Ettori (2005) model (green dashed line) are also plotted .
Current usage metrics show cumulative count of Article Views (full-text article views including HTML views, PDF and ePub downloads, according to the available data) and Abstracts Views on Vision4Press platform.
Data correspond to usage on the plateform after 2015. The current usage metrics is available 48-96 hours after online publication and is updated daily on week days.
Initial download of the metrics may take a while.