Fig. 6
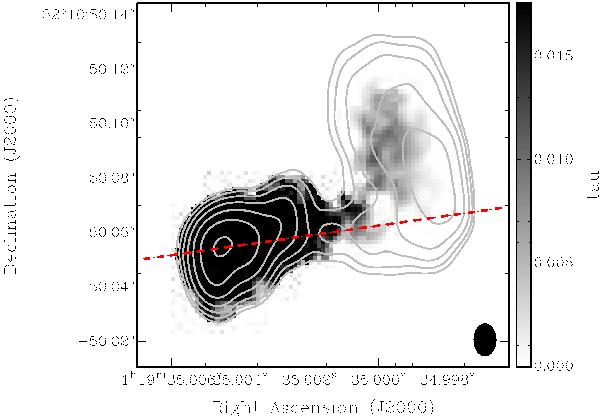
4C 31.04: contours show continuum, the lowest contour is at 5 mJy beam-1 with subsequent contours increasing by factors of 2. Grayscale shows the mean opacity over the rest frame velocity range −174 km s-1 to + 138 km s-1. The beam FWHM is indicated in the lower right corner. The dashed line indicates the location of the position–velocity slice presented in Fig. 8.
Current usage metrics show cumulative count of Article Views (full-text article views including HTML views, PDF and ePub downloads, according to the available data) and Abstracts Views on Vision4Press platform.
Data correspond to usage on the plateform after 2015. The current usage metrics is available 48-96 hours after online publication and is updated daily on week days.
Initial download of the metrics may take a while.