Fig. 5
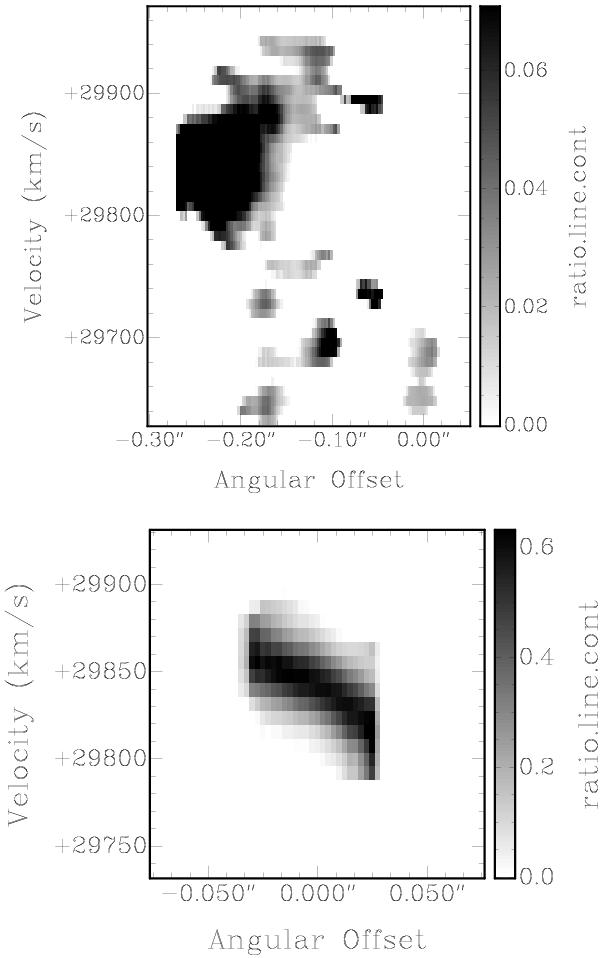
3C 236: position–velocity diagrams of the line-to-continuum ratio cube. Top panel: slice along PA = 117° through the nucleus and through the peak at the southeastern lobe (as indicated by long dashed line in Fig. 3). Bottom panel: slice perpendicular to the slice in the top panel (PA = 27°), at the edge of the southeastern jet (as indicated by short dashed line in Fig. 3).
Current usage metrics show cumulative count of Article Views (full-text article views including HTML views, PDF and ePub downloads, according to the available data) and Abstracts Views on Vision4Press platform.
Data correspond to usage on the plateform after 2015. The current usage metrics is available 48-96 hours after online publication and is updated daily on week days.
Initial download of the metrics may take a while.