Fig. 3
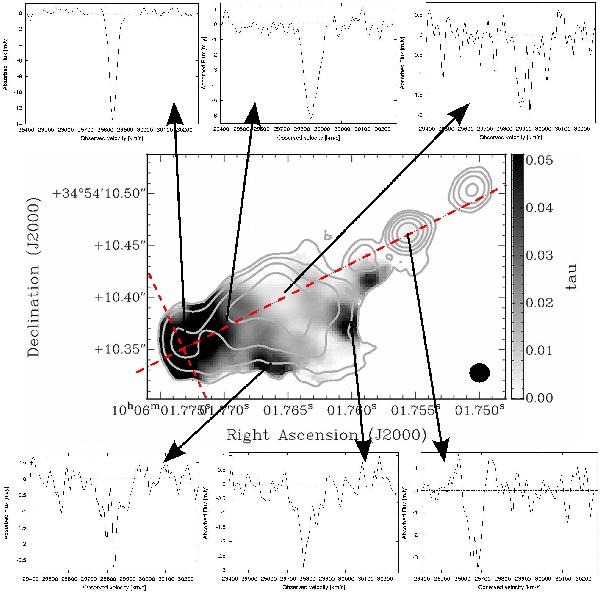
3C 236: middle panel: contours show continuum (same contour levels as Fig. 1). Grayscale shows the mean opacity over the rest frame velocity range −192 km s-1 to + 167 km s-1. The beam FWHM is indicated in the lower right corner. The surrounding spectra show the absorption profiles at different locations indicated by the arrows. The dashed lines indicate the location of the two position–velocity slices presented in Fig. 5.
Current usage metrics show cumulative count of Article Views (full-text article views including HTML views, PDF and ePub downloads, according to the available data) and Abstracts Views on Vision4Press platform.
Data correspond to usage on the plateform after 2015. The current usage metrics is available 48-96 hours after online publication and is updated daily on week days.
Initial download of the metrics may take a while.