Fig. 14
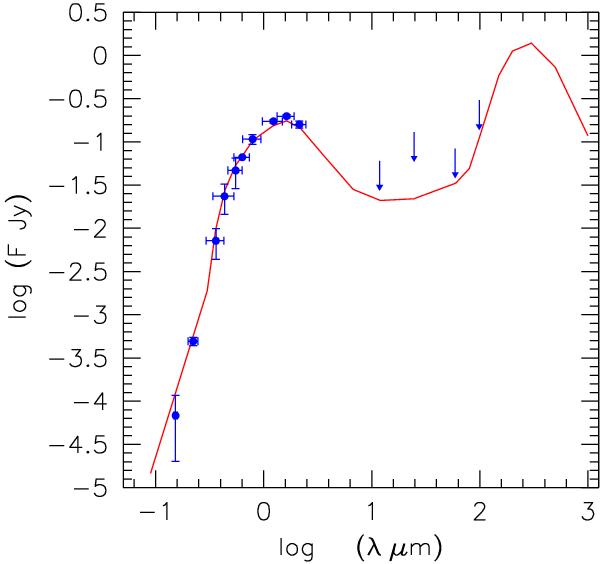
Spectral energy distribution for NGC 4756: (blue) filled circles correspond to data from NED and Grützbauch et al. (2005a) in B and R bands. Arrows show upper limits; error bars indicate the band width and 3σ uncertainties. The continuous line (red) shows the predictions of our model (see text). Dust components (warm and cold with PAH, discussed in Mazzei et al. 1992) with the same average properties derived by Mazzei & De Zotti (1994) for a complete sample of nearby early-type galaxies are included (i.e. I0 = 46 Ilocal, Iw = 200 Ilocal, Rwc = 0.27 and rd = 100 rc, see in Mazzei et al. 1994).
Current usage metrics show cumulative count of Article Views (full-text article views including HTML views, PDF and ePub downloads, according to the available data) and Abstracts Views on Vision4Press platform.
Data correspond to usage on the plateform after 2015. The current usage metrics is available 48-96 hours after online publication and is updated daily on week days.
Initial download of the metrics may take a while.