Fig. 13
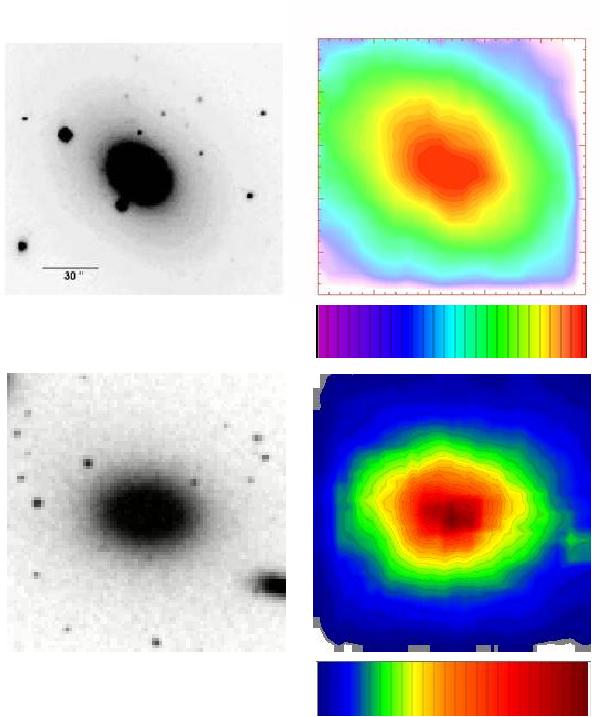
Left: 2.5′ × 2.5′R-band DSS image of NGC 4756 (top) and of NGC 5328 (bottom). Right: R map, of YZ projection of the selected snapshot, on the same scale as DSS image: 60 equispaced levels with density contrast equal to hundred, normalized to the total flux in the map; the lower panel shows the color distribution of different levels, from the maximum, red, to the minimum value, violet.
Current usage metrics show cumulative count of Article Views (full-text article views including HTML views, PDF and ePub downloads, according to the available data) and Abstracts Views on Vision4Press platform.
Data correspond to usage on the plateform after 2015. The current usage metrics is available 48-96 hours after online publication and is updated daily on week days.
Initial download of the metrics may take a while.