Free Access
Fig. 8
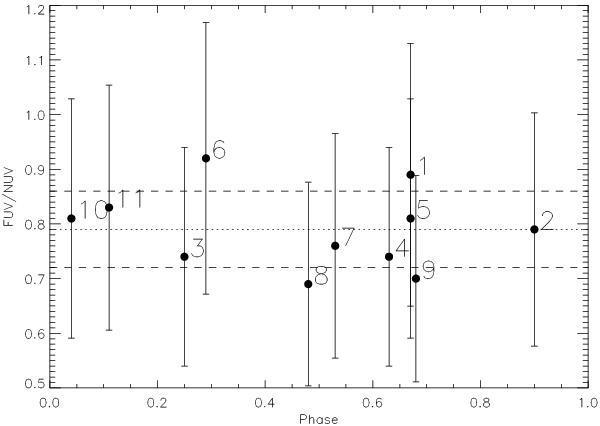
Ratio of individual FUV/NUV integrated fluxes phased to the derived orbital period. The dotted and dashed lines give the mean and standard deviation of the eleven spectra. Grism observation numbers are given next to each data point. The constant UV “colour” is consistent with the constant hardness ratio in the Swift data.
Current usage metrics show cumulative count of Article Views (full-text article views including HTML views, PDF and ePub downloads, according to the available data) and Abstracts Views on Vision4Press platform.
Data correspond to usage on the plateform after 2015. The current usage metrics is available 48-96 hours after online publication and is updated daily on week days.
Initial download of the metrics may take a while.