Fig. 1
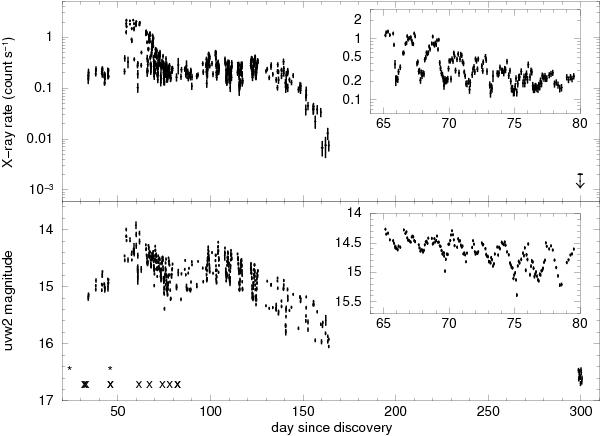
Swift-XRT 0.3–1.0 keV (top) and UVOT uvw2 (bottom) light-curves of HV Cet. Inset into both panels is a expanded view of the light-curves from day 65 to 80, which covers the first high cadence campaign. The X-ray count rate is plotted with a logarithmic scale for ease of comparison with the UV magnitudes. The discovery date is taken as 2008-Oct-07 at 09:08:49 UTC. In the lower panel, * and × symbols mark the times of the GALEX imaging and grism observations respectively.
Current usage metrics show cumulative count of Article Views (full-text article views including HTML views, PDF and ePub downloads, according to the available data) and Abstracts Views on Vision4Press platform.
Data correspond to usage on the plateform after 2015. The current usage metrics is available 48-96 hours after online publication and is updated daily on week days.
Initial download of the metrics may take a while.