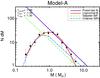
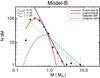
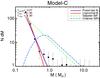
Fig. 7
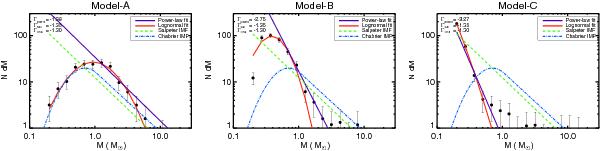
The IMFs of the primary models. The images display the time-averaged IMFs between 1 and 3 free-fall times, where tff = 105 yr. From left to right, the magnetic field strength increases from 0, 38 to 135 μG. In each image, for comparison purposes, the Salpeter IMF (green dashed) and the Chabrier IMF (blue dot-dashed) are displayed (with arbitrary values along the Y-axis). Two best fits are applied to the data, a power-law fit and a lognormal fit, and are shown as purple and red lines. With the exception of the lognormal fit, the slopes above the characteristic mass are given in the upper left corner.
Current usage metrics show cumulative count of Article Views (full-text article views including HTML views, PDF and ePub downloads, according to the available data) and Abstracts Views on Vision4Press platform.
Data correspond to usage on the plateform after 2015. The current usage metrics is available 48-96 hours after online publication and is updated daily on week days.
Initial download of the metrics may take a while.