Fig. 3
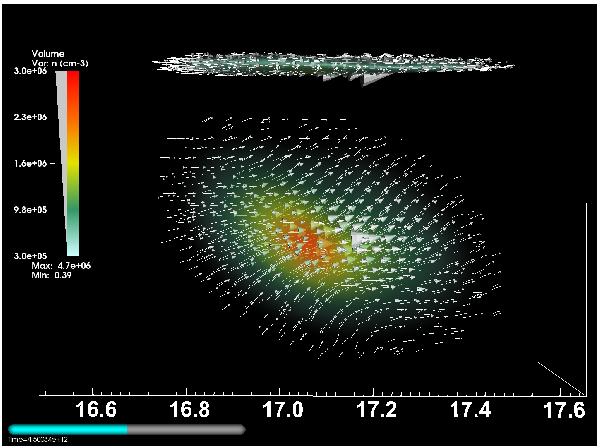
Magnetic field vectors versus disk orientation. The magnetic field lines align with the disk between ~1.0−1.5 tff. The image shows a volume plot of the density from an XZ perspective (top) and an XY perspective (bottom) at t = 1.5 tff. The magnetic field vectors are displayed as white arrows, where the field strength B typically ranges from 1−1000 μG. The X-axis is given at the bottom in units of parsec.
Current usage metrics show cumulative count of Article Views (full-text article views including HTML views, PDF and ePub downloads, according to the available data) and Abstracts Views on Vision4Press platform.
Data correspond to usage on the plateform after 2015. The current usage metrics is available 48-96 hours after online publication and is updated daily on week days.
Initial download of the metrics may take a while.