Fig. 8
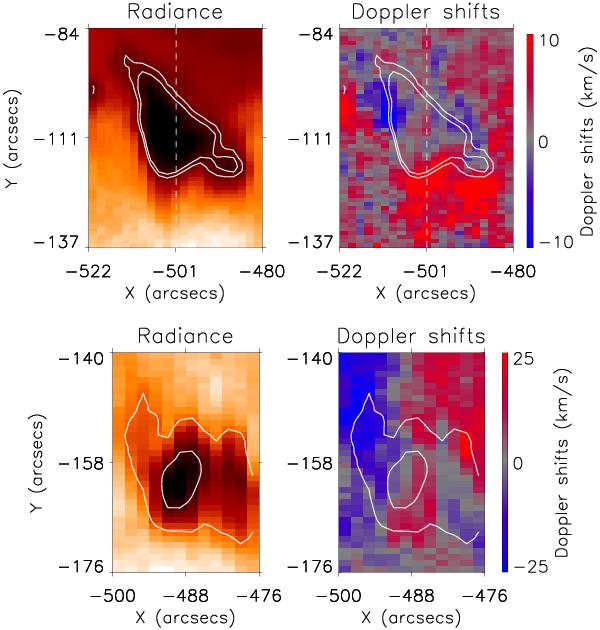
Two examples, event 9 (top) and 11 (bottom) of brightening events observed on November 9. The left and right panels represent the Fe xii 195 Å intensity and Doppler shift images, respectively. The event 9 raster is taken between 07:03 UT and 07:24 UT and the raster for event 11 is from 11:47 UT to 11:59 UT (see the online material to follow its full evolution). Event 9 is at the coronal hole boundary while event 11 is inside the coronal hole. White dashed lines indicate the SUMER slit sit-and-stare position. The radiance images are plotted in negative logarithmic scale.
Current usage metrics show cumulative count of Article Views (full-text article views including HTML views, PDF and ePub downloads, according to the available data) and Abstracts Views on Vision4Press platform.
Data correspond to usage on the plateform after 2015. The current usage metrics is available 48-96 hours after online publication and is updated daily on week days.
Initial download of the metrics may take a while.