Free Access
Fig. 5
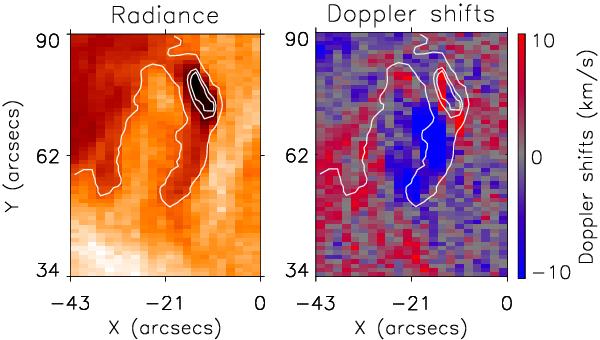
Event No. 1 on January 10. The raster was taken in the Fe xii 195 Å line between 12:35 UT and 12:59 UT. The left and right panels represent the Fe xii 195 Å intensity and Doppler shift images, respectively. The intensity image is plotted in negative logarithmic scale.
Current usage metrics show cumulative count of Article Views (full-text article views including HTML views, PDF and ePub downloads, according to the available data) and Abstracts Views on Vision4Press platform.
Data correspond to usage on the plateform after 2015. The current usage metrics is available 48-96 hours after online publication and is updated daily on week days.
Initial download of the metrics may take a while.