Free Access
Fig. 1
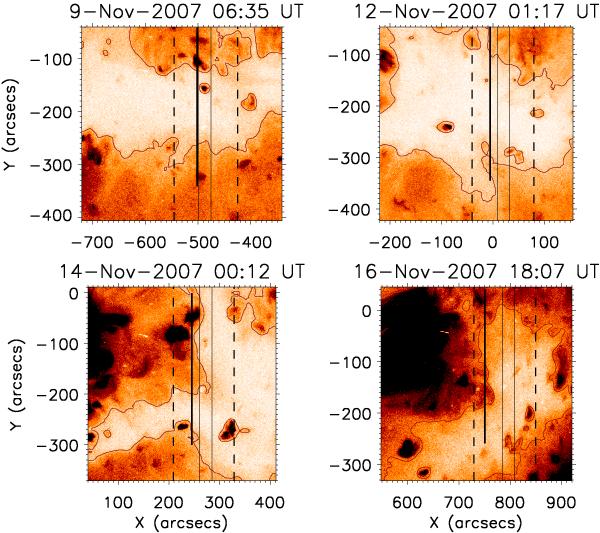
XRT images of the four days of coronal hole observations. The dashed lines show the large EIS raster field-of-view while the thin solid lines denote the small raster FOV. The SUMER slit-and-stare position is shown with a thick solid line. Contours of XRT images outline the coronal holes as defined in Paper II.
Current usage metrics show cumulative count of Article Views (full-text article views including HTML views, PDF and ePub downloads, according to the available data) and Abstracts Views on Vision4Press platform.
Data correspond to usage on the plateform after 2015. The current usage metrics is available 48-96 hours after online publication and is updated daily on week days.
Initial download of the metrics may take a while.