Fig. 5
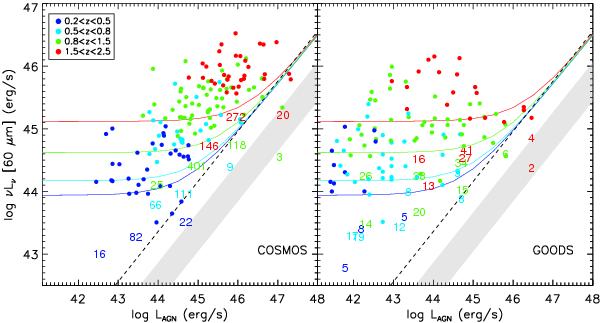
νLν(60 μm) vs. LAGN of X-ray selected AGNs in 4 redshift bins from z = 0.2 to z = 2.5. Galaxies in the GOODS and COSMOS fields have been separated into right and left panels respectively, as they differ greatly in both X-ray and PACS depths. Colored points are AGNs detected in both bands. Colored numbers show the location of stacked measurements and the number of objects that go into the stack. Dashed and solid lines, as well as shaded regions, are the same as in Fig. 4. Note the apparent correlation in the colored points in the left panel, which is absent in the right panel. The correlation is primarily driven by selection effects inherent with wide and shallow surveys.
Current usage metrics show cumulative count of Article Views (full-text article views including HTML views, PDF and ePub downloads, according to the available data) and Abstracts Views on Vision4Press platform.
Data correspond to usage on the plateform after 2015. The current usage metrics is available 48-96 hours after online publication and is updated daily on week days.
Initial download of the metrics may take a while.