Fig. 4
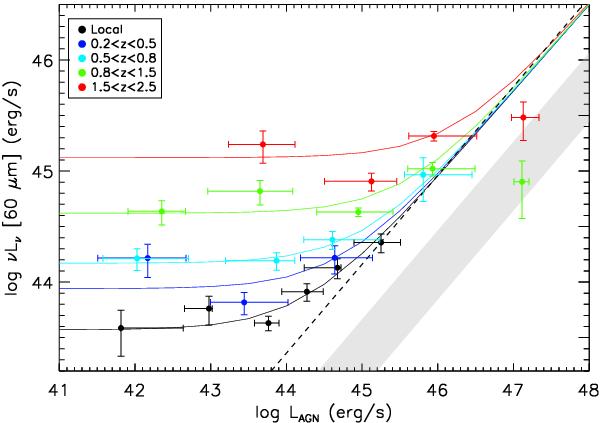
Mean νLν(60 μm) (L60) vs. LAGN of X-ray selected AGNs in 5 different redshift bins from the local Universe to z = 2.5. The colored data points are combinations of mean measurements in 3 PEP fields: GOODS-N/S and COSMOS, while the black data points come from our analysis of the SWIFT-BAT sample. The solid colored lines are functional fits to the mean measurements, as described in Sect. 4.1.1. The dashed line is the correlation line shown by AGN-dominated systems in Netzer (2009). The shaded region corresponds to the approximate 1σ range exhibited by empirical pure-AGN SEDs. At low redshifts, a strong change in the mean trend exists as a function of LAGN, which disappears at high redshifts. The mean L60 of low-luminosity X-ray AGNs increases monotonically with redshift, mirroring the increase in the mean SFR of massive galaxies across redshift.
Current usage metrics show cumulative count of Article Views (full-text article views including HTML views, PDF and ePub downloads, according to the available data) and Abstracts Views on Vision4Press platform.
Data correspond to usage on the plateform after 2015. The current usage metrics is available 48-96 hours after online publication and is updated daily on week days.
Initial download of the metrics may take a while.