Fig. 3
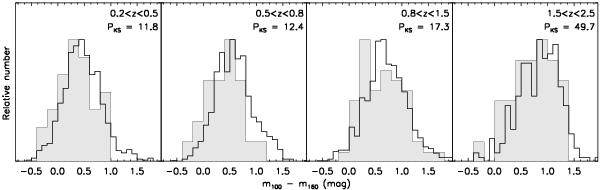
Distributions of m100–160 for COSMOS PACS-detected AGNs (shaded histogram) compared to the general population of PACS detected galaxies in the COSMOS field. Each panel is a different redshift bin, indicated in the upper right corner of the panel. Also in the upper right is a measure of the KS probability PKS that the two distributions share a common parent distribution. The distributions are most different at z < 1 but become more similar at higher redshift. Note, systems with likely AGN contamination are not excluded from this plot.
Current usage metrics show cumulative count of Article Views (full-text article views including HTML views, PDF and ePub downloads, according to the available data) and Abstracts Views on Vision4Press platform.
Data correspond to usage on the plateform after 2015. The current usage metrics is available 48-96 hours after online publication and is updated daily on week days.
Initial download of the metrics may take a while.