Fig. 2
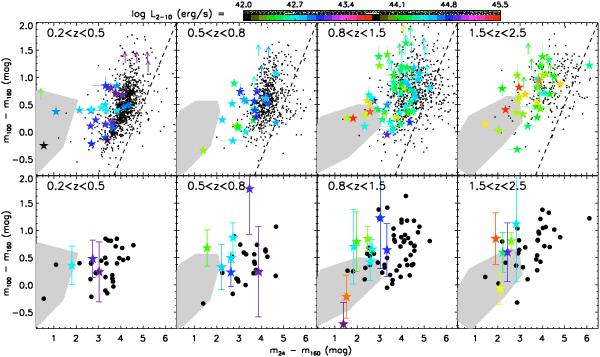
Observed IR colors of X-ray AGNs plotted in bins of redshift. A MIR flux ratio (the flux at 24 μm to the flux at 160 μm, expressed as a magnitude) is plotted against an FIR flux ratio (the flux at 100 μm to the flux at 160 μm, also as a magnitude). The shaded grey regions mark out parts of the diagram occupied by star-forming galaxies with an AGN fraction of >50% at rest-frame 60 μm (Sect. 3.2). Top row panels: PACS-detected AGNs from the COSMOS field are shown as star-shaped points, with colors that represent their hard-band X-ray luminosity LX (shown in the color bar at top). The small black dots are all galaxies that are detected in the COSMOS PACS maps in the same redshift bins. Objects with colors right and below the dashed line are unlikely to be detected because of the photometric limits of the MIR and FIR catalogs. Bottom row panels: stacked measurements for PACS-undetected AGNs from all three fields are shown as star-shaped points, colored by LX. For reference, the large black points show the locations of PACS-detected COSMOS AGNs (the same as the colored points in the top panels). PACS-undetected AGNs have, on average, warmer IR colors and may be more AGN dominated in the FIR.
Current usage metrics show cumulative count of Article Views (full-text article views including HTML views, PDF and ePub downloads, according to the available data) and Abstracts Views on Vision4Press platform.
Data correspond to usage on the plateform after 2015. The current usage metrics is available 48-96 hours after online publication and is updated daily on week days.
Initial download of the metrics may take a while.