Fig. 2
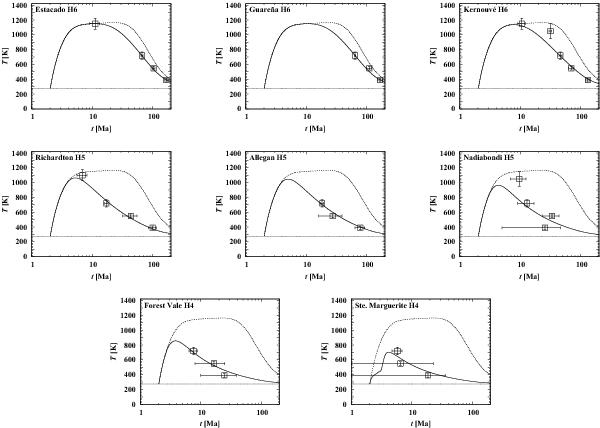
Results for the individual meteorites used in the model fit. The values of the free parameters and the burial depth’s of the meteorites found for the optimised model are given in Table 5. The full line shows the temperature evolution at the burial depth’s of the meteorites in the asteroid, as determined by the evolution algorithm. The dashed line shows the temperature evolution at the centre and the dotted line is the surface temperature. The square boxes indicate the individual data points and the error bars the uncertainty of closing temperature and age determinations.
Current usage metrics show cumulative count of Article Views (full-text article views including HTML views, PDF and ePub downloads, according to the available data) and Abstracts Views on Vision4Press platform.
Data correspond to usage on the plateform after 2015. The current usage metrics is available 48-96 hours after online publication and is updated daily on week days.
Initial download of the metrics may take a while.