Fig. 1
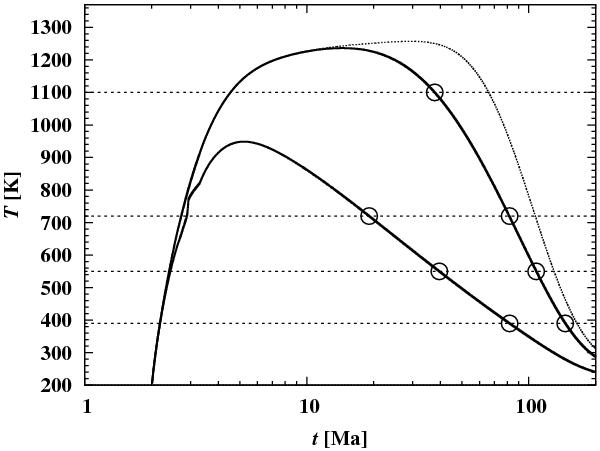
Schematic representation of the temperature evolution at two different depths (full lines) and at the centre (dotted line) of a planetesimal of the 100 km size class. The horizontal dashed lines correspond to fixed temperatures equal to the closure temperatures in Table 1. The circles indicate the instants at which at a given depth the temperature drops below a given temperature. These instants correspond to the closure ages of the different thermochronometers used for meteorites.
Current usage metrics show cumulative count of Article Views (full-text article views including HTML views, PDF and ePub downloads, according to the available data) and Abstracts Views on Vision4Press platform.
Data correspond to usage on the plateform after 2015. The current usage metrics is available 48-96 hours after online publication and is updated daily on week days.
Initial download of the metrics may take a while.