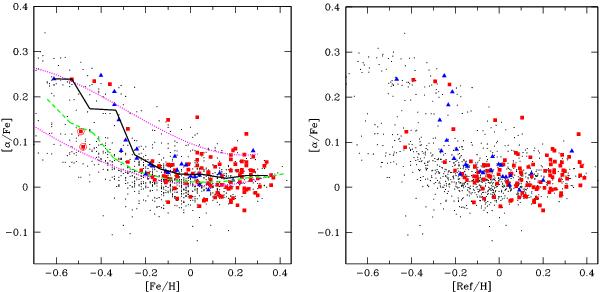
Fig. 5

[α/Fe] versus [Fe/H] (left) and [α/Fe] versus [Ref/Fe] (right) for the total sample. The red squares refer to the Jovian hosts and the blue triangles refer to the stars hosting exclusively Neptunians and super-Earths. The black dots represent the stars without planets. The black solid and green dashed lines represent the mean distributions of the planet host and non-host samples, respectively. The magenta dotted lines are the cubic fits for the low-α (thin disc) and the high-α (thick disk + high-α metal-rich) stars. The two metal-poor Jovian hosts in the red circles are the stars with low log g values discussed in Sect. 3.2.
Current usage metrics show cumulative count of Article Views (full-text article views including HTML views, PDF and ePub downloads, according to the available data) and Abstracts Views on Vision4Press platform.
Data correspond to usage on the plateform after 2015. The current usage metrics is available 48-96 hours after online publication and is updated daily on week days.
Initial download of the metrics may take a while.


