Fig. 9
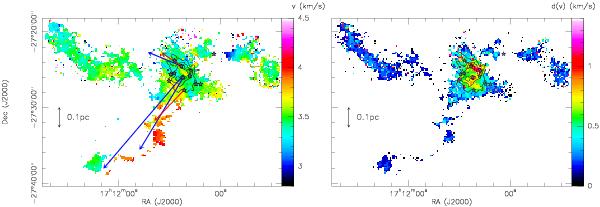
C18O moment maps: mean velocity on the left panel, and velocity dispersion (FWHM) on the right, in colour scale overplotted with the integrated intensity in contours, and with the sources plotted as grey stars. The outflows identified in Fig. 8 are also indicated as blue and red arrows on the left-hand panel for comparison with the local velocity fields.
Current usage metrics show cumulative count of Article Views (full-text article views including HTML views, PDF and ePub downloads, according to the available data) and Abstracts Views on Vision4Press platform.
Data correspond to usage on the plateform after 2015. The current usage metrics is available 48-96 hours after online publication and is updated daily on week days.
Initial download of the metrics may take a while.