Fig. 8
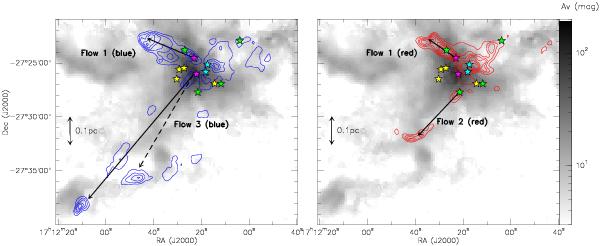
Contours of the 12CO blue-shifted and red-shifted emission (left and right panels respectively). Contours start at 3 K km s-1 for the blue emission and at 4 K km s-1 for the red, with steps of 2 K km s-1, overlaid on the extinction map of B59 as from Fig. 1 in gray scale. The black arrows show the different individual outflows used to calculate individual outflow properties: Flow 1 (blue and red), Flow 2 (red) and Flow 3 (blue).
Current usage metrics show cumulative count of Article Views (full-text article views including HTML views, PDF and ePub downloads, according to the available data) and Abstracts Views on Vision4Press platform.
Data correspond to usage on the plateform after 2015. The current usage metrics is available 48-96 hours after online publication and is updated daily on week days.
Initial download of the metrics may take a while.