Fig. 5
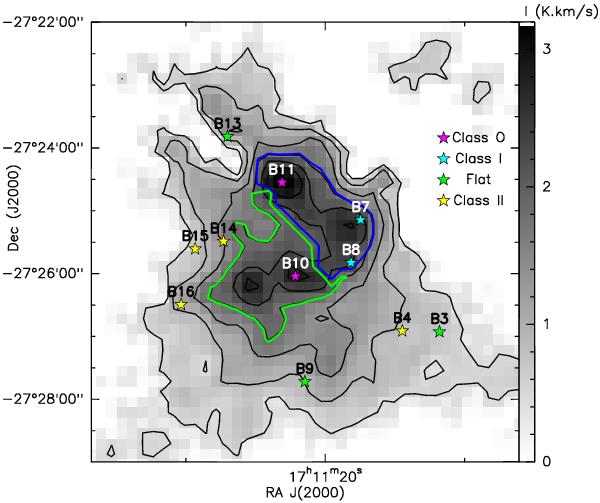
Integrated intensity of C18O (3–2) in the central region of B59 (gray scale and contours). The protostars are marked with star symbols, and labeled following Brooke et al. (2007). The green and blue contoured regions correspond to the regions identified from the C18O scatter plot (see text and Fig. 4 left panel), and the green and blue departures of the 13CO integrated emission. Though adjacent, these two regions have a temperature difference of ~2 K, the blue region being warmer. Note that while the colder green region hosts a single protostar (B10) and a “starless” C18O peak, the warmer blue region has three embedded protostellar objects (B11, B7 and B8).
Current usage metrics show cumulative count of Article Views (full-text article views including HTML views, PDF and ePub downloads, according to the available data) and Abstracts Views on Vision4Press platform.
Data correspond to usage on the plateform after 2015. The current usage metrics is available 48-96 hours after online publication and is updated daily on week days.
Initial download of the metrics may take a while.