Fig. 4
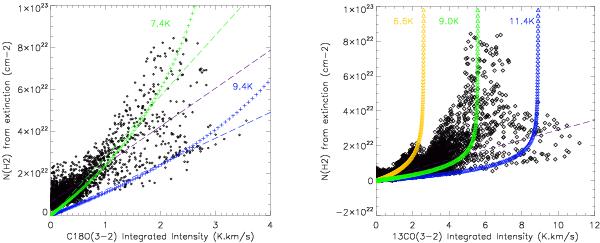
Scatter plots of the H2 column density derived from the extinction map against the C18O (left) and 13CO (right) integrated intensity ( K km s-1) for each pixel in the map. The purple dashed-lines represent the linear fit of the data points, with an upper limit constraint on the column density for the case of 13CO. Overlaid on the scatter plots are the predictions of RADEX models at different gas temperatures (on the left: 7.4 K in green and 9.4 K in blue crosses; on the right: 6.6 K in yellow, 9.0 K in green and 11.4 K in blue triangles). For the C18O (left) the green and blue dashed lines represent the linear approximations to the respective colour-coded RADEX model.
Current usage metrics show cumulative count of Article Views (full-text article views including HTML views, PDF and ePub downloads, according to the available data) and Abstracts Views on Vision4Press platform.
Data correspond to usage on the plateform after 2015. The current usage metrics is available 48-96 hours after online publication and is updated daily on week days.
Initial download of the metrics may take a while.