Fig. 2
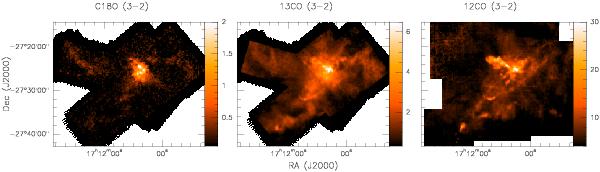
Integrated intensity ( K km s-1) maps of the three isotopologues observed. For the C18O (left) and 13CO (middle), the integration range was 1 to 5.5 km s-1. The 12CO (right) was integrated from −5 to 15 km s-1. Here we can see that the C18O follows the shape as seen in extinction (Fig. 1), while the 13CO emission starts to pick up the outflowing material, best seen in the 12CO emission dominated by high velocity gas.
Current usage metrics show cumulative count of Article Views (full-text article views including HTML views, PDF and ePub downloads, according to the available data) and Abstracts Views on Vision4Press platform.
Data correspond to usage on the plateform after 2015. The current usage metrics is available 48-96 hours after online publication and is updated daily on week days.
Initial download of the metrics may take a while.