Fig. A.2
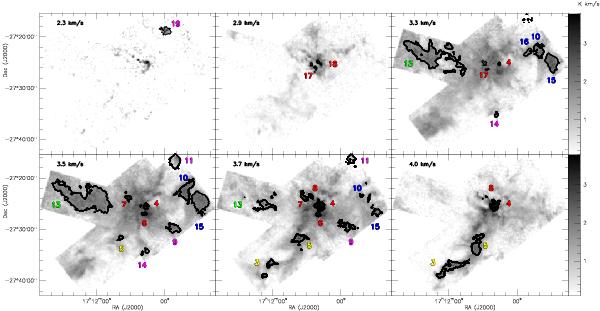
Six channel maps of the 13CO emission,  , whose velocities are shown at the top-left corner of each panel. The plotted grayscale is that used for all panels with the exception of the first (top-left panel), where it is from 0.1 to 1.5 K km s-1. The black contours show the positions of the leaves from Fig. A.1, whose numbering is colour-coded to visually separate the distinct areas: central region in red, NE ridge in green, SE U-shaped ridge in yellow, western cores in blue, and loose knots in purple.
Current usage metrics show cumulative count of Article Views (full-text article views including HTML views, PDF and ePub downloads, according to the available data) and Abstracts Views on Vision4Press platform.
Data correspond to usage on the plateform after 2015. The current usage metrics is available 48-96 hours after online publication and is updated daily on week days.
Initial download of the metrics may take a while.