Fig. 12
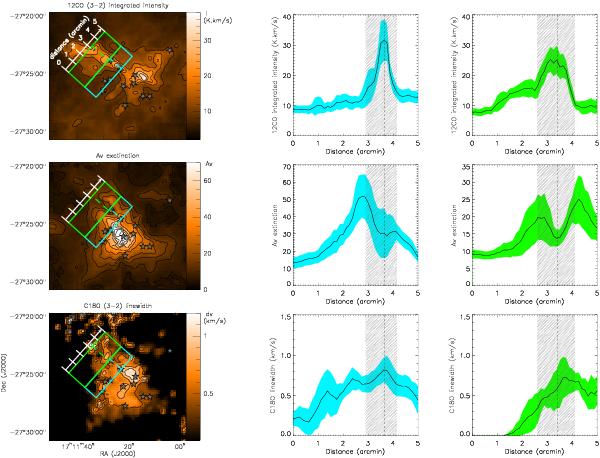
Left column: close up of the central region of B59, where the colour scale and contours are the 12CO integrated intensity map (top), the visual extinction map (centre) and the C18O linewidth map (bottom). The regions used to estimate the average profiles (shown in the centre and right columns) across Flow 1 are shown as blue and green boxes. The dashed lines show the position of the peak of 12CO integrated intensity as averaged within each box. Centre and right columns: average profiles of 12CO integrated intensity (top row panels), visual extinction (central row panels), and C18O linewidth (FWHM, bottom row panels). Each column corresponds to a different averaging box, colour-coded as in the left column. The dashed lines and gray-shadowed areas mark the peak and extent of the 12CO profile as seen on the first row panels, respectively. The colour-coded shaded areas show the 1-sigma dispersion of each quantity.
Current usage metrics show cumulative count of Article Views (full-text article views including HTML views, PDF and ePub downloads, according to the available data) and Abstracts Views on Vision4Press platform.
Data correspond to usage on the plateform after 2015. The current usage metrics is available 48-96 hours after online publication and is updated daily on week days.
Initial download of the metrics may take a while.