Fig. 11
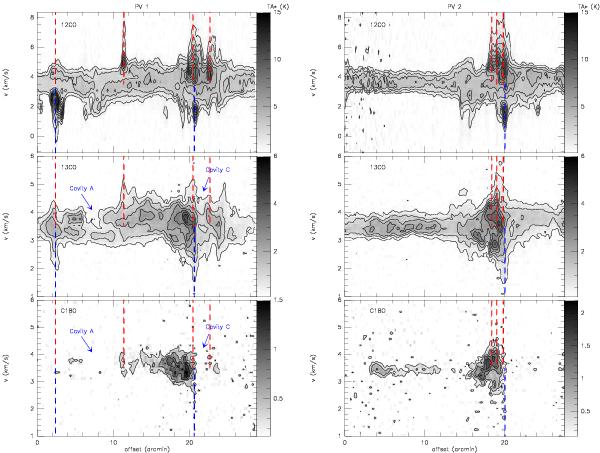
P-V diagrams of B59 in 12CO (top panels), 13CO (centre) and C18O (lower panels). Each column is the P-V cut as labeled at the top and as shown in Fig. 10. The position of some of the outflows are indicated with blue and red dashed lines and cavities are also indicated. The contours are from 1 K with steps of 1 K for 12CO, from 0.3 K with steps of 0.6 K for 13CO and from 0.25 K with steps of 0.3 K for C18O (in  ).
).
Current usage metrics show cumulative count of Article Views (full-text article views including HTML views, PDF and ePub downloads, according to the available data) and Abstracts Views on Vision4Press platform.
Data correspond to usage on the plateform after 2015. The current usage metrics is available 48-96 hours after online publication and is updated daily on week days.
Initial download of the metrics may take a while.