Fig. 10
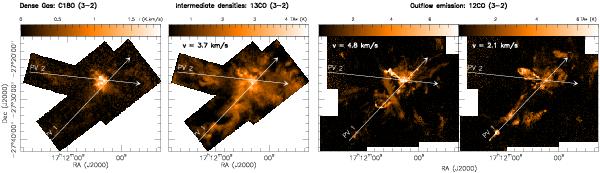
Left: integrated intensity ( ) map of C18O showing the distribution of the dense gas in B59; centre-left: 13CO channel map at v = 3.7 km s-1 (slightly red-shifted with respect to the cloud’s ambient velocities of 3.5 km s-1), tracing the intermediate density gas, and showing some of the cavities discussed in the text; centre-right and right: 12CO channel maps at v = 4.8 km s-1 and v = 2.1 km s-1 respectively, illustrating the red-shifted and blue-shifted outflows of the region. The position of the two position-velocity (P-V) diagrams of Fig. 11 are shown as white arrows and labeled as PV 1 and PV 2 in the four panels.
Current usage metrics show cumulative count of Article Views (full-text article views including HTML views, PDF and ePub downloads, according to the available data) and Abstracts Views on Vision4Press platform.
Data correspond to usage on the plateform after 2015. The current usage metrics is available 48-96 hours after online publication and is updated daily on week days.
Initial download of the metrics may take a while.