Free Access
Fig. 4
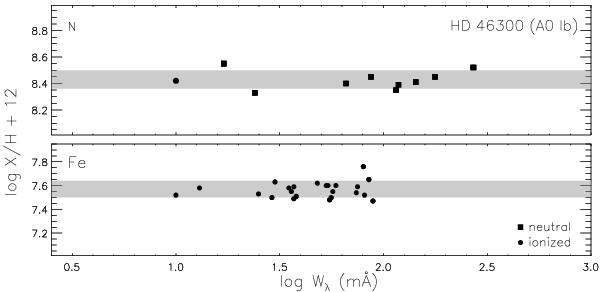
Abundance values derived from single lines are presented versus respective equivalent widths for a selection of lines from neutral and ionized nitrogen and iron in the spectrum of HD 46300 (A0 Ib). The 1σ-scatter around the mean value is indicated by the gray bands.
Current usage metrics show cumulative count of Article Views (full-text article views including HTML views, PDF and ePub downloads, according to the available data) and Abstracts Views on Vision4Press platform.
Data correspond to usage on the plateform after 2015. The current usage metrics is available 48-96 hours after online publication and is updated daily on week days.
Initial download of the metrics may take a while.