Fig. 2
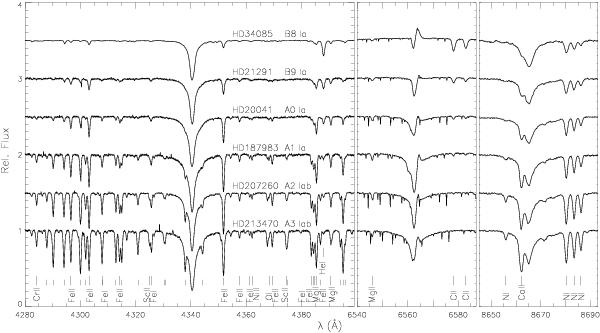
Normalised spectra of an Teff-sequence of sample stars around Hγ (left), Hα (middle) and Pa13 (right panel), from the hot (top) to the cool end of the parameter range investigated here (bottom). The major spectral features are identified, short vertical marks indicate Ti ii lines. The Hα region is contaminated by narrow telluric lines. Vertical shifts of the spectra by multiples of 0.5 have been applied for clarity.
Current usage metrics show cumulative count of Article Views (full-text article views including HTML views, PDF and ePub downloads, according to the available data) and Abstracts Views on Vision4Press platform.
Data correspond to usage on the plateform after 2015. The current usage metrics is available 48-96 hours after online publication and is updated daily on week days.
Initial download of the metrics may take a while.