Fig. 3
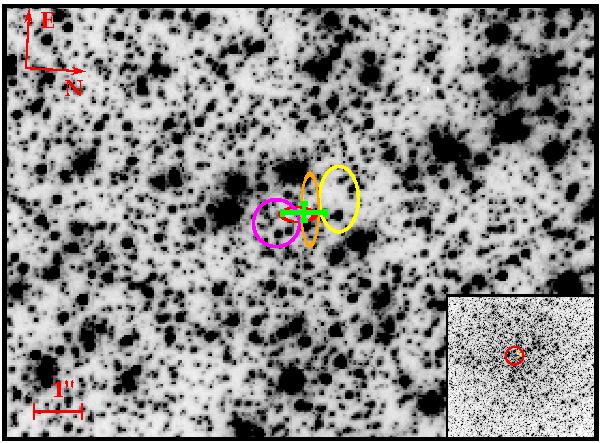
Finding chart for the center of NGC 2808. The magenta circle marks the center of NG06, the red ellipse the results from the pie wedges method, the orange ellipse is for the isodensity contour method and the yellow one shows the position and error of the method measuring the light distribution. The final adopted center and its error bar are displayed in green.
Current usage metrics show cumulative count of Article Views (full-text article views including HTML views, PDF and ePub downloads, according to the available data) and Abstracts Views on Vision4Press platform.
Data correspond to usage on the plateform after 2015. The current usage metrics is available 48-96 hours after online publication and is updated daily on week days.
Initial download of the metrics may take a while.