Fig. 2
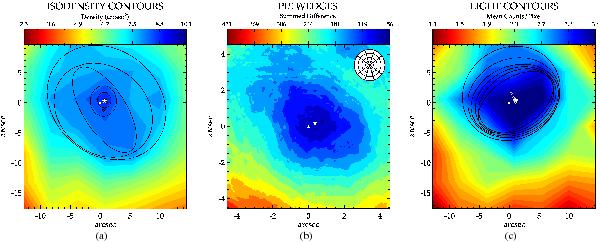
Method to determine the globular cluster center. a) Ellipses fitted to isodensity contours. b) The contours of the cumulative pie wedges method. The wedges are shown in the upper right of the plot. c) Shows the contours of the pixel analysis of the mapped image. Contours in blue mark areas of either high stellar density in a), high symmetry (i.e. low differences between the wedges) in b) or high light density in c). In every plot the triangle marks the center adopted by NG06 and the white star the newly derived center.
Current usage metrics show cumulative count of Article Views (full-text article views including HTML views, PDF and ePub downloads, according to the available data) and Abstracts Views on Vision4Press platform.
Data correspond to usage on the plateform after 2015. The current usage metrics is available 48-96 hours after online publication and is updated daily on week days.
Initial download of the metrics may take a while.