Fig. 4
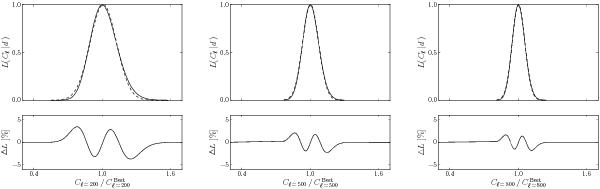
The likelihood is non-Gaussian. Upper row: varying the power spectrum coefficients for different multipole values, we plot slices of the likelihood function (solid lines) at low (ℓ = 200, left panel), intermediate (ℓ = 500, middle panel), and high multipoles (ℓ = 800, right panel). We also show the best fitting Gaussian distributions (dashed lines). Lower row: the absolute residual between the likelihood function and its Gaussian fit is of the order of several percent.
Current usage metrics show cumulative count of Article Views (full-text article views including HTML views, PDF and ePub downloads, according to the available data) and Abstracts Views on Vision4Press platform.
Data correspond to usage on the plateform after 2015. The current usage metrics is available 48-96 hours after online publication and is updated daily on week days.
Initial download of the metrics may take a while.