Fig. 3
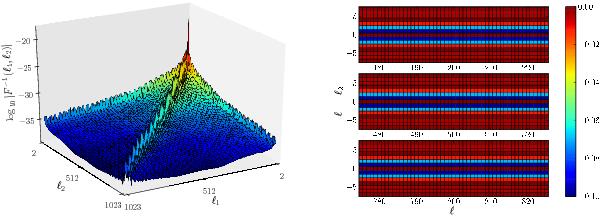
The correlation structure between power spectrum coefficients is complicated. Left panel: we plot the inverse of the Fisher matrix, i.e. the covariance matrix of the experiment. For illustrative purposes, we inverted the x and y axes. Right panel: patches around the diagonal elements of the normalized correlation matrix at low (ℓ = 200, upper row), intermediate (ℓ = 500, middle row), and high multipoles (ℓ = 800, lower row) reveal significant negative correlations between neighboring power spectrum coefficients at the 10% level.
Current usage metrics show cumulative count of Article Views (full-text article views including HTML views, PDF and ePub downloads, according to the available data) and Abstracts Views on Vision4Press platform.
Data correspond to usage on the plateform after 2015. The current usage metrics is available 48-96 hours after online publication and is updated daily on week days.
Initial download of the metrics may take a while.