Fig. 1
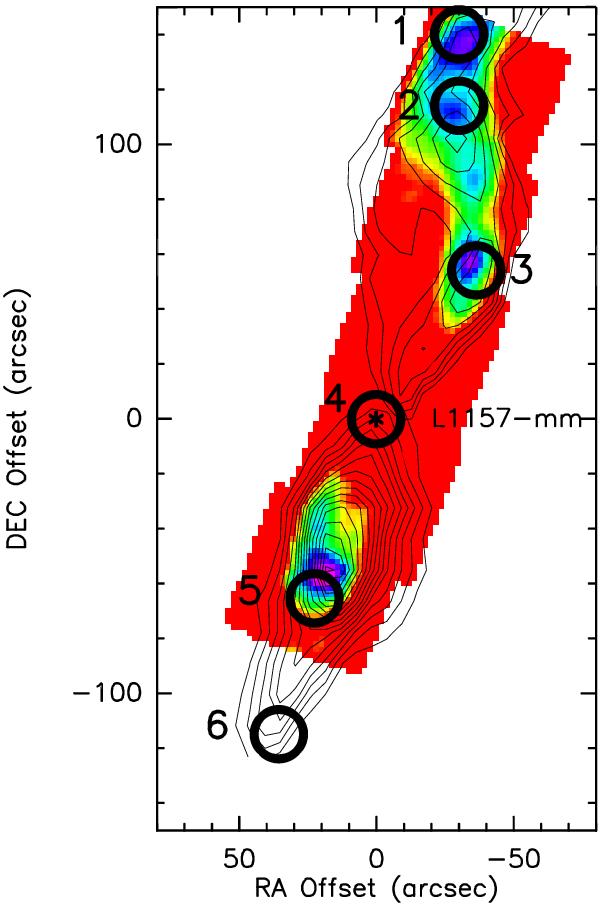
Positions observed with SOFIA in the L1157 bipolar outflow, which is emanating from the embedded Class 0 source L1157-mm. The background colour map shows an image in the H2 0–0 S(1) line at 17 μm (from Nisini et al. 2010b) with superposed contours of the integrated CO (2–1) emission (from Bachiller et al. 2001). The targeted positions of the presented CO (12–11) observations with GREAT are labelled and indicated with circles, with diameters equal to the actual beam size of 21 3 of the GREAT beam.
Current usage metrics show cumulative count of Article Views (full-text article views including HTML views, PDF and ePub downloads, according to the available data) and Abstracts Views on Vision4Press platform.
Data correspond to usage on the plateform after 2015. The current usage metrics is available 48-96 hours after online publication and is updated daily on week days.
Initial download of the metrics may take a while.