Fig. 4
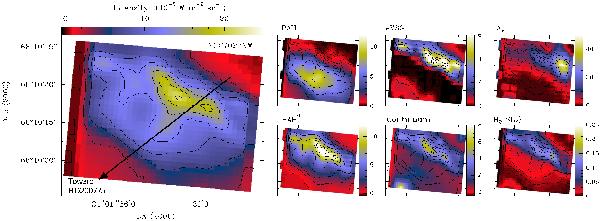
Maps of the different components obtained using PAHTAT to fit the observed mid-IR spectra of the NGC 7023 NW IRS spectral cube. Integrated intensities in the 5.5–14 μm range of the total emission (left map) and of the different band template components (central panels) are displayed. The map of the column density expressed in AV is also shown, as well as the flux in the H2 S(3) line (right maps). The black arrow shows the direction of the spatial cut studied in this work (Fig. 10). Contours of the total emission map are given in steps of 3 × 10⁻⁵ W m-2 sr-1 and are reported for reference in all the maps. The color intensity scales are in units of 10-5 W m-2 sr-1, while the column density is expressed in magnitude of visual extinction. Results for the other resolved PDRs can be found in Fig. 9.
Current usage metrics show cumulative count of Article Views (full-text article views including HTML views, PDF and ePub downloads, according to the available data) and Abstracts Views on Vision4Press platform.
Data correspond to usage on the plateform after 2015. The current usage metrics is available 48-96 hours after online publication and is updated daily on week days.
Initial download of the metrics may take a while.