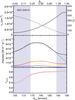
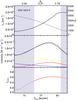
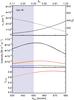
Fig. 10
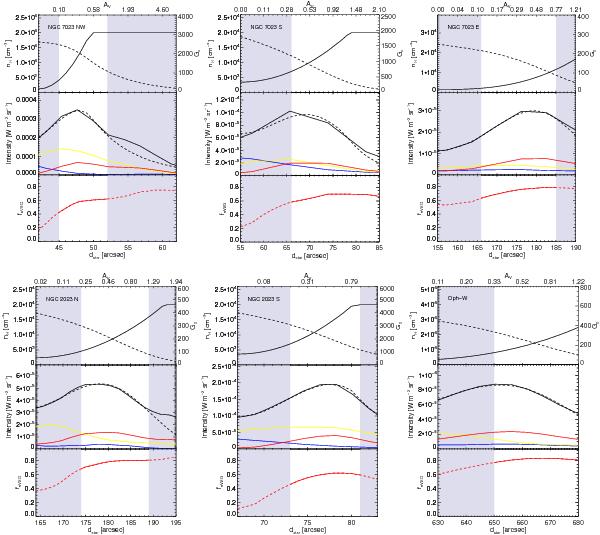
Compilation of our results along each PDR cut defined in Figs. 4 and 9. Upper panels: the local density and UV radiation field profiles as a function of the distance from the star along the r or AV axis of Fig. A.1. Central panels: blue, yellow, and red represent the contribution of PAH+, PAH0 and eVSGs, respectively, as extracted from the fit. Solid black lines represent the corrected mid-IR emission profile. The dotted lines represent the fit obtained with the geometrical model described in Appendix A. Lower panels: the variation in the fraction of carbon atoms locked in eVSGs relative to the total carbon in all the AIB carriers. The grey-shaded regions are those that were not considered in Fig. 6 and Eq. (5).
Current usage metrics show cumulative count of Article Views (full-text article views including HTML views, PDF and ePub downloads, according to the available data) and Abstracts Views on Vision4Press platform.
Data correspond to usage on the plateform after 2015. The current usage metrics is available 48-96 hours after online publication and is updated daily on week days.
Initial download of the metrics may take a while.