Fig. 1
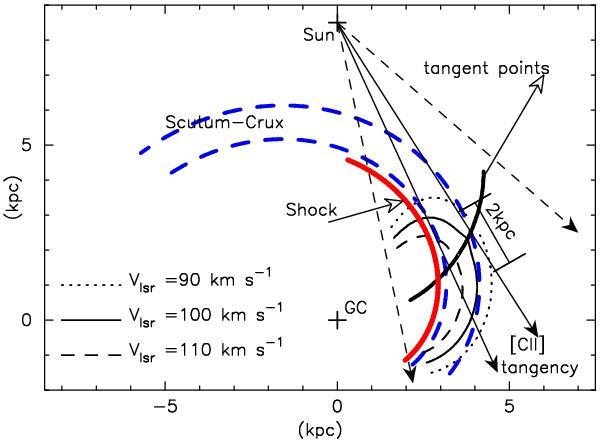
Schematic of the Scutum-Crux spiral arm (blue dashed lines). The dashed arrows indicate the GOT C+ mapped data presented in this paper, and solid arrows the tangency longitude range traced by [C ii] emission. The radial velocity contours, spiral density wave shock (red arc), and the loci of the tangent points (heavy dark arc) are indicated.
Current usage metrics show cumulative count of Article Views (full-text article views including HTML views, PDF and ePub downloads, according to the available data) and Abstracts Views on Vision4Press platform.
Data correspond to usage on the plateform after 2015. The current usage metrics is available 48-96 hours after online publication and is updated daily on week days.
Initial download of the metrics may take a while.