Fig. 1
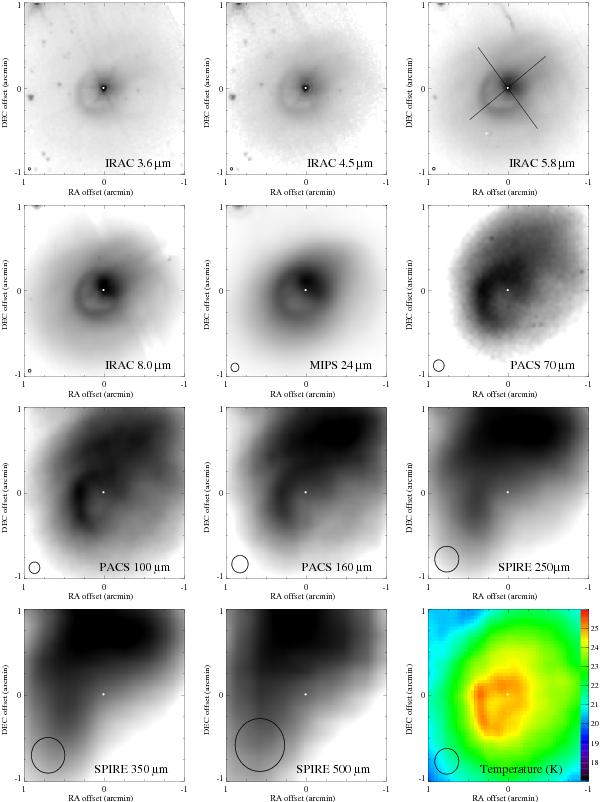
Images of HD 97300 at different wavelengths. The coordinates are relative to RA Dec2000 = −76°36′47
 72. The scaling is logarithmic. Each panel is 2′ × 2′, and north is up, east is left. The diameter of the circles in the bottom left corners corresponds to the FWHM of the PSF. The small white dot in each image indicates the stellar position. The lines in the upper right panel show the directions along which the cuts in Fig. 2 were measured. The bottom right panel shows the dust temperature on a linear scale as measured by fitting a modified black body to the 100, 160, and 250 μm images (see the text for details).
Current usage metrics show cumulative count of Article Views (full-text article views including HTML views, PDF and ePub downloads, according to the available data) and Abstracts Views on Vision4Press platform.
Data correspond to usage on the plateform after 2015. The current usage metrics is available 48-96 hours after online publication and is updated daily on week days.
Initial download of the metrics may take a while.