Free Access
Fig. 4
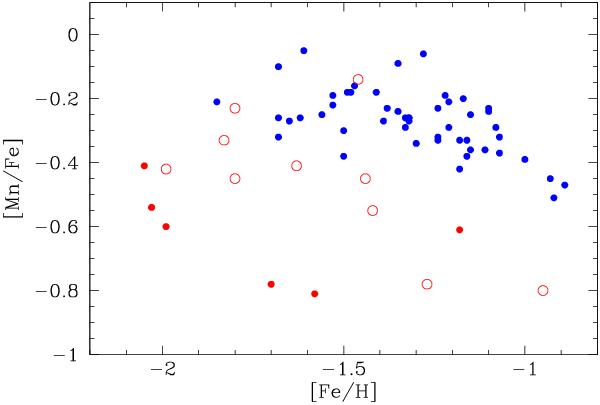
Same as Fig. 3, but for Sculptor only (blue dots), showing a plateau followed by a decreasing trend rather than a monotonic decrease in [Mn/Fe]. Results for the globular cluster ω Centauri are also shown as red circles (Cunha et al. 2010) and red dots (Pancino et al. 2011).
Current usage metrics show cumulative count of Article Views (full-text article views including HTML views, PDF and ePub downloads, according to the available data) and Abstracts Views on Vision4Press platform.
Data correspond to usage on the plateform after 2015. The current usage metrics is available 48-96 hours after online publication and is updated daily on week days.
Initial download of the metrics may take a while.