Fig. 3
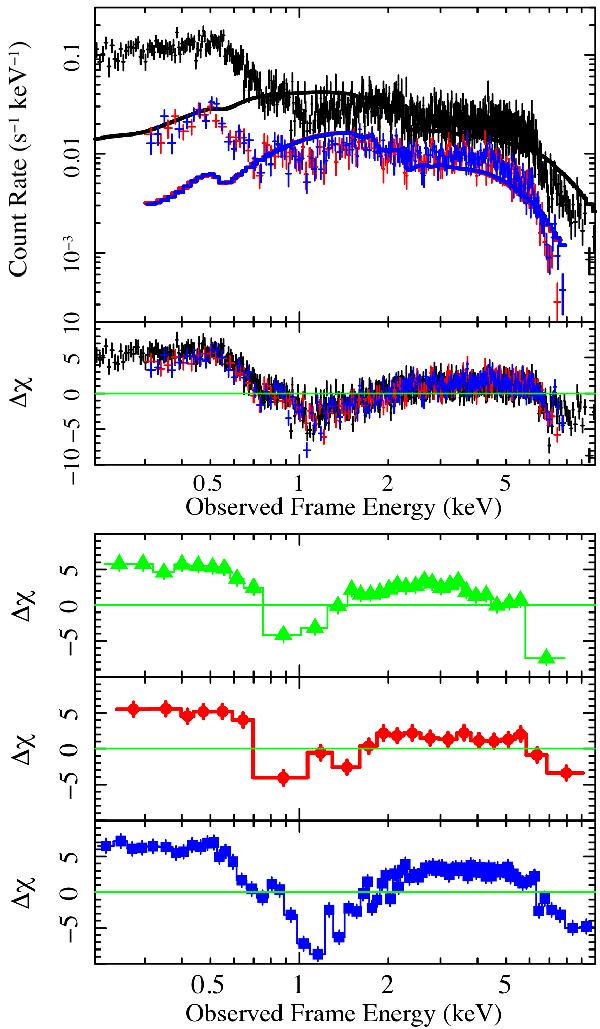
Top panel: average 2009 Long Look pn (black), MOS1 (red), and MOS2 (blue) spectra modeled with a power-law emission absorbed by the Galactic interstellar medium, along with the residuals to the model, scaled by the error bar. Bottom panel: spectral residuals to the power-law model for the other three epochs: Dec. 2008 (green triangles), Jun. 2008 (red circles), and Dec. 2004 (blue squares); the data have been rebinned for visual purpose only to respectively 5, 5, and 7σ.
Current usage metrics show cumulative count of Article Views (full-text article views including HTML views, PDF and ePub downloads, according to the available data) and Abstracts Views on Vision4Press platform.
Data correspond to usage on the plateform after 2015. The current usage metrics is available 48-96 hours after online publication and is updated daily on week days.
Initial download of the metrics may take a while.