Fig. 2
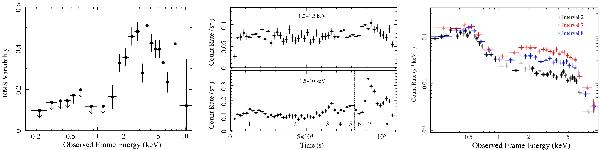
Variability on kilosecond time scales detected during the 2009 Long Look observation. Left panel: rms variability computed for the pn observation over the 0.2−10 keV band; arrows mark upper limits, error bars are at 1σ confidence level. Middle panel: 0.2 − 1.5 and 1.5−10 keV background-subtracted pn light curves binned to 2 ks; the numbers in the 1.5 − 10 keV light curve mark the eight time intervals on which time-resolved spectral analysis was performed. Right panel: three representative spectra extracted during the 2nd, the 7th, and the 8th time intervals of the 2009 Long Look observation.
Current usage metrics show cumulative count of Article Views (full-text article views including HTML views, PDF and ePub downloads, according to the available data) and Abstracts Views on Vision4Press platform.
Data correspond to usage on the plateform after 2015. The current usage metrics is available 48-96 hours after online publication and is updated daily on week days.
Initial download of the metrics may take a while.