Fig. 21
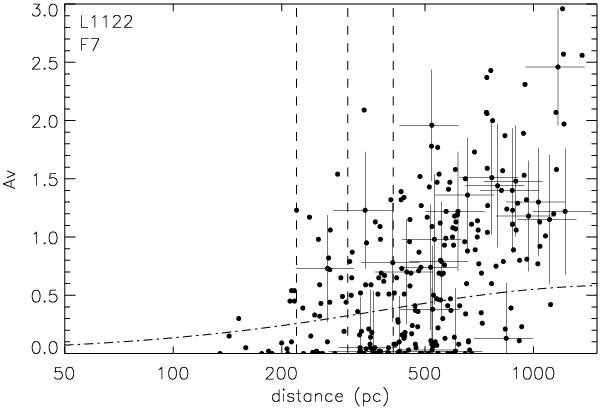
The AV vs. d plot for all the stars classified as dwarfs towards L1122. The dashed vertical lines are drawn at 220 pc, 301 pc, and 408 pc. The dash-dotted curve represents the increase in extinction towards the Galactic latitude b = + 14.8° as a function of distance based on the expressions given by BS80. The error bars are shown for only a few stars to be able to distinguish more clearly between the points.
Current usage metrics show cumulative count of Article Views (full-text article views including HTML views, PDF and ePub downloads, according to the available data) and Abstracts Views on Vision4Press platform.
Data correspond to usage on the plateform after 2015. The current usage metrics is available 48-96 hours after online publication and is updated daily on week days.
Initial download of the metrics may take a while.