Fig. 14
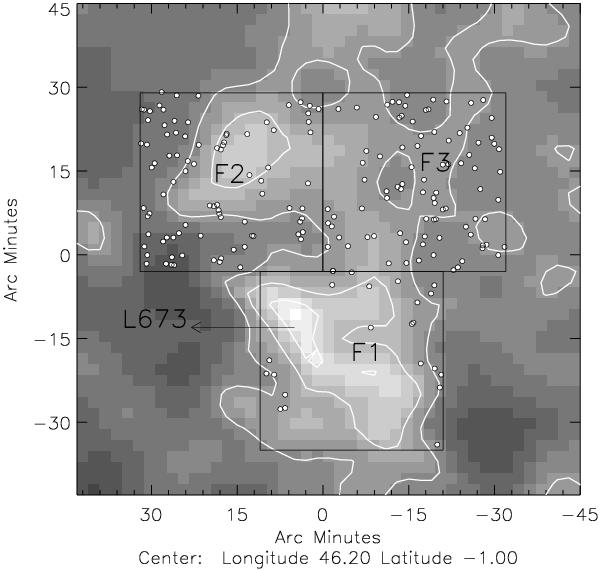
The 1.5° × 1.5° extinction map produced by Dobashi et al. (2005) of the region containing L673-7. The contours are drawn at the 4.0 and 5.0 mag levels. The fields used to select stars to determine distances are identified and labelled. The stars classified as dwarfs using the near-IR photometry in each field are shown using filled circles. Each field covers an area of 0.5° × 0.5°.
Current usage metrics show cumulative count of Article Views (full-text article views including HTML views, PDF and ePub downloads, according to the available data) and Abstracts Views on Vision4Press platform.
Data correspond to usage on the plateform after 2015. The current usage metrics is available 48-96 hours after online publication and is updated daily on week days.
Initial download of the metrics may take a while.