Fig. 9
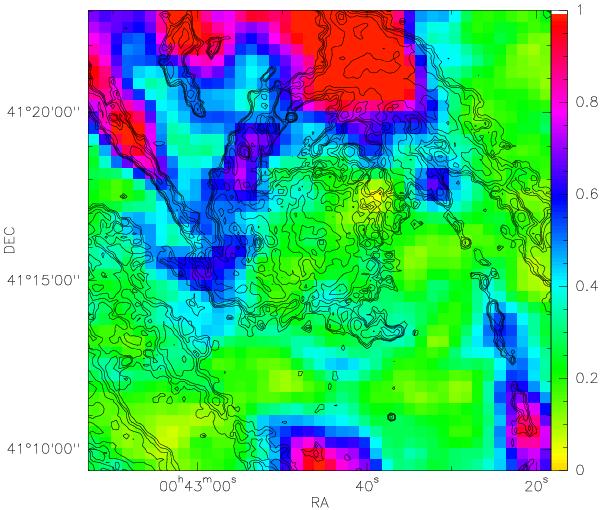
Image of the HI emission in the very centre, avoiding ± 100 km s-1 around the systemic velocity of − 310 km s-1. This cut has been made to subtract the large-scale HI emission seen in projection superposed to the centre, expected near the systemic velocity. The contours are the dust emission from Spitzer-IRAC (8 μm image where a scaled version of the 3.6 μm image has been subtracted to remove the stellar photospheres emission) (Block et al. 2006). The HI cube is from Braun et al (2009).
Current usage metrics show cumulative count of Article Views (full-text article views including HTML views, PDF and ePub downloads, according to the available data) and Abstracts Views on Vision4Press platform.
Data correspond to usage on the plateform after 2015. The current usage metrics is available 48-96 hours after online publication and is updated daily on week days.
Initial download of the metrics may take a while.