Free Access
Fig. A.1
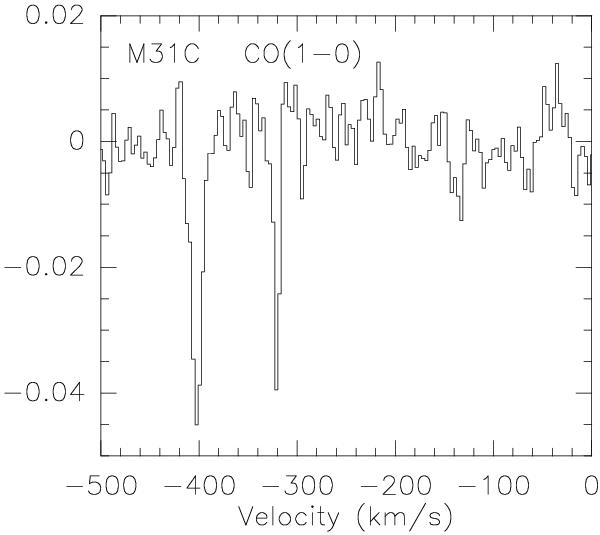
Signal detected in 2000 at the J2000 coordinates RA 00:43:18.5 Dec +41:17:06, in the OFF signal of position switch observations of M 31C. This spectrum, corresponding to an exposure time of 80 min, was reduced to a 24′′ beam. The y axis displays antenna temperature  .
.
Current usage metrics show cumulative count of Article Views (full-text article views including HTML views, PDF and ePub downloads, according to the available data) and Abstracts Views on Vision4Press platform.
Data correspond to usage on the plateform after 2015. The current usage metrics is available 48-96 hours after online publication and is updated daily on week days.
Initial download of the metrics may take a while.